Morgantown Utility Board Copper (Cu) Results 2019
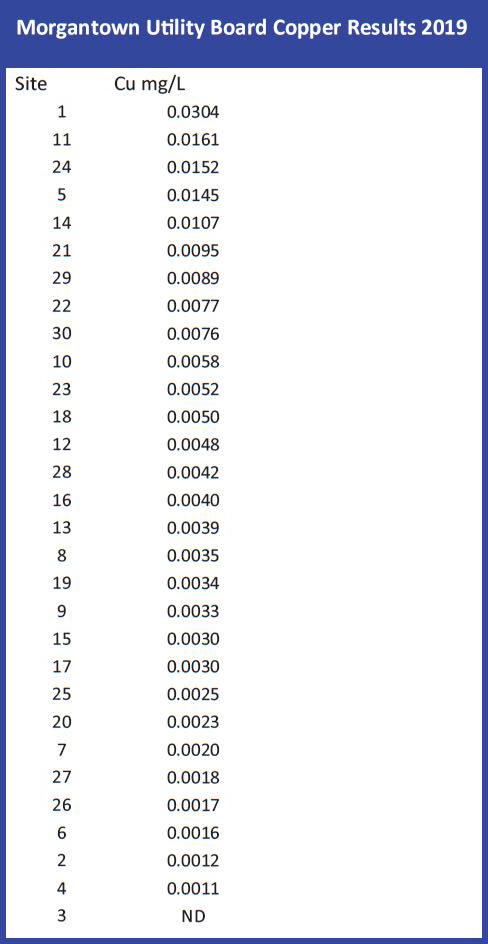
Lead and copper analysis is performed once every three (3) years, on water samples throughout our water distribution system. Our analysis for 2019 showed that the 90th percentile of the ranked analysis results were, 0.8 ppb for lead and 0.0152 ppm for copper. All results were found to be well below the action levels as set by our state health department. Our next scheduled sampling for lead and copper is set for 2022.
The below table is also available in PDF format via Dropbox by clicking here.
Please note that "ND" is Non-Detectable which means the result is below the method detection limit.